Surface Automotives

![]()


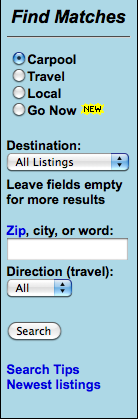
eRideShare.com
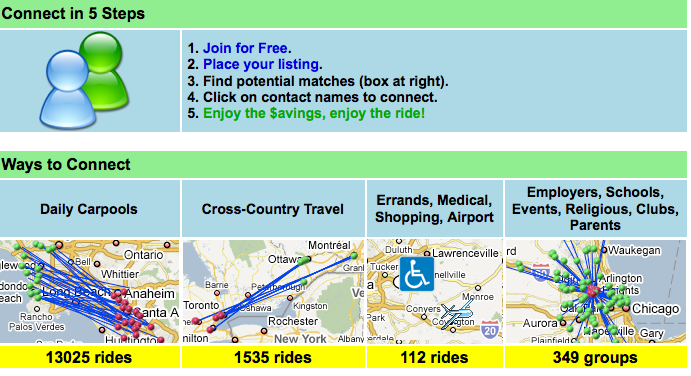
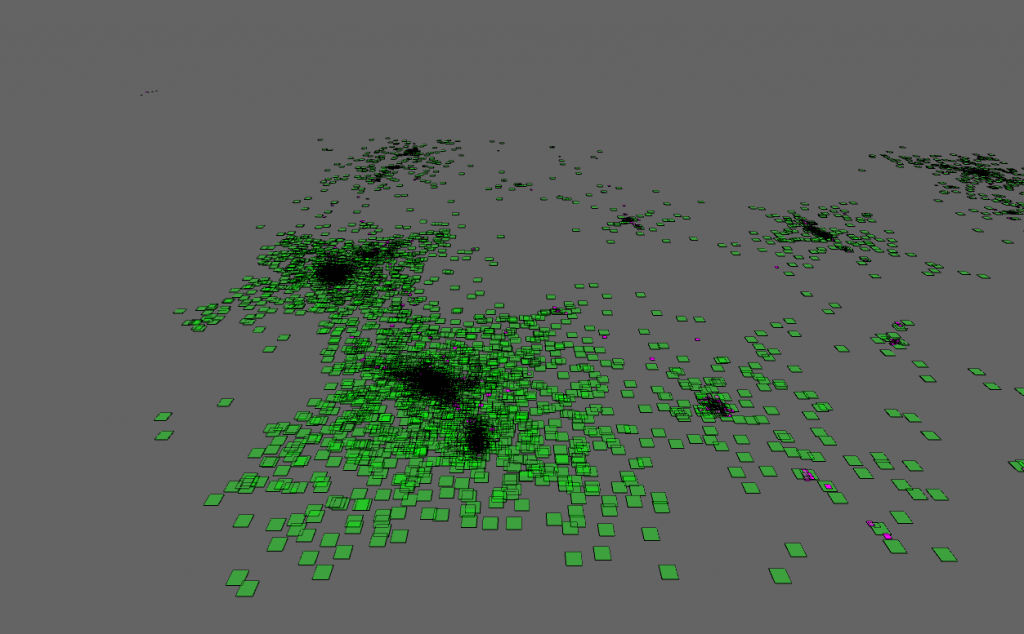
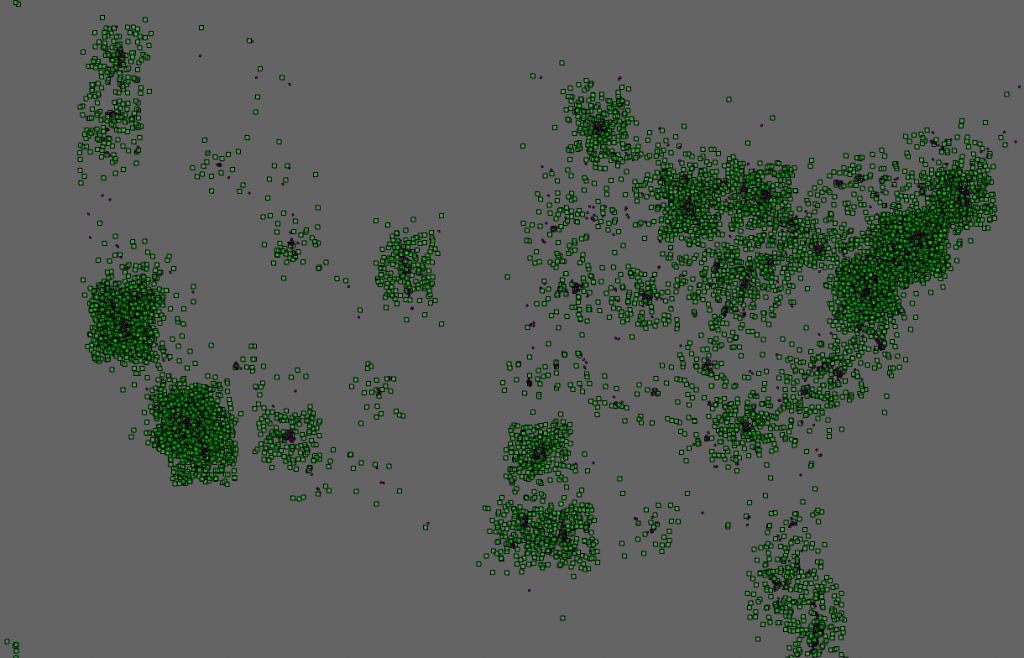
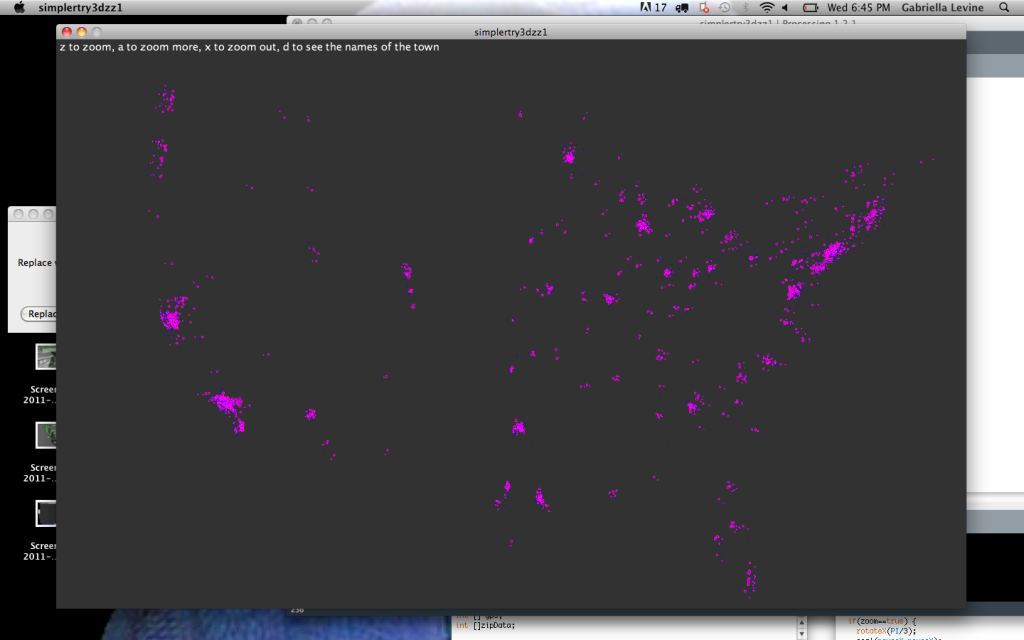
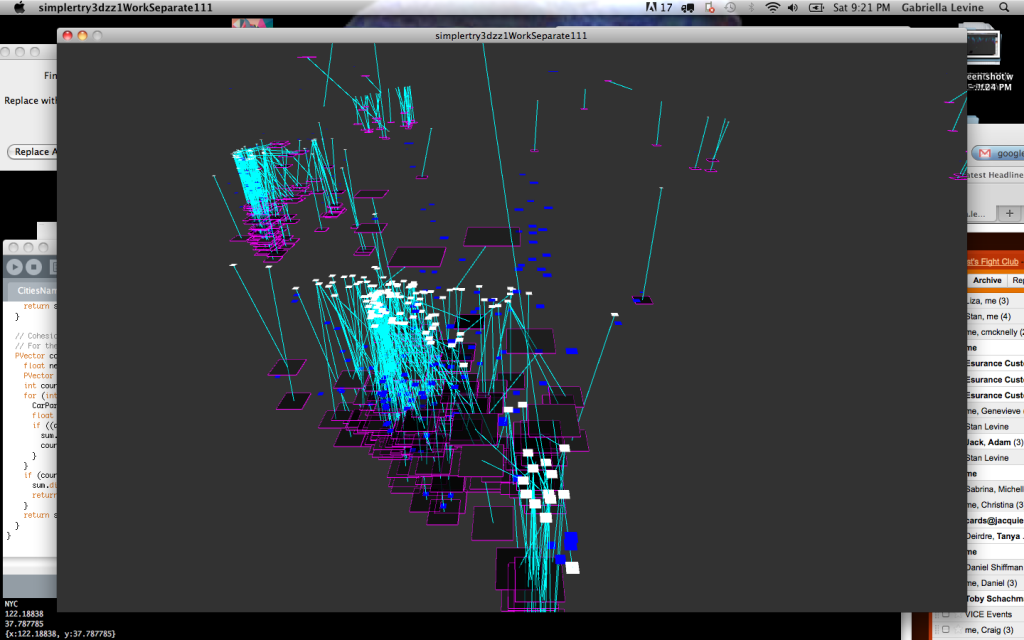
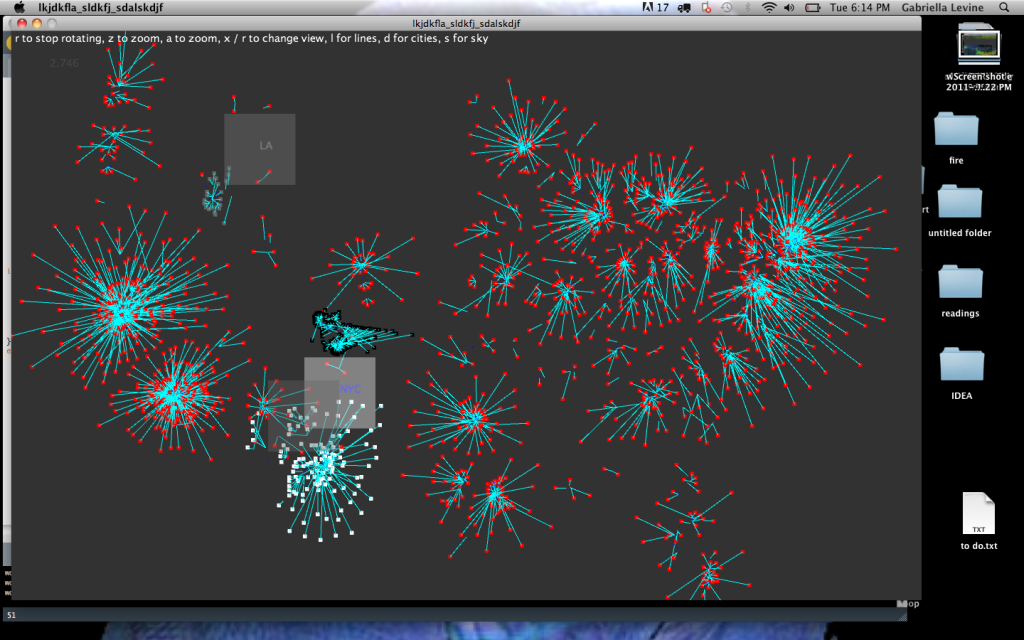
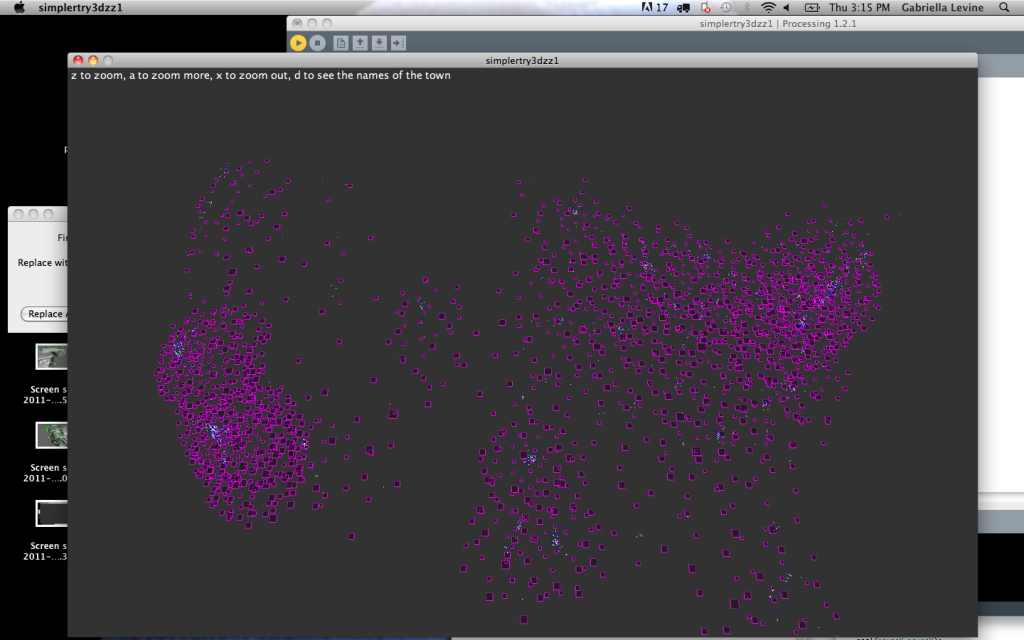
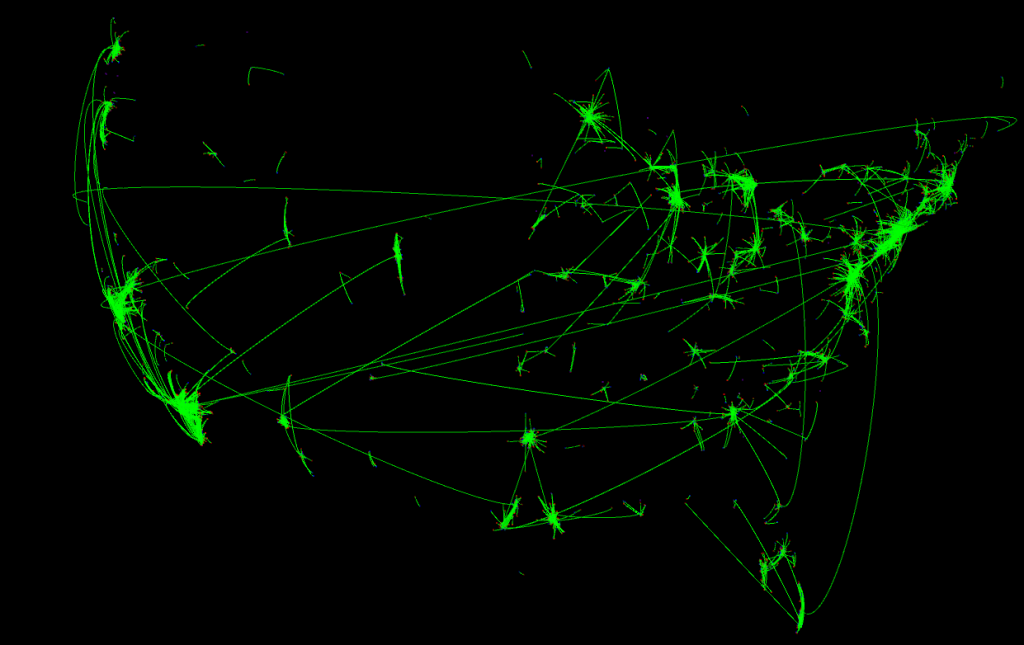
eRideShare.com is a website where people can easily connect and share rides. It is widely used throughout the world. Each day, there are about 10,000 ride share requests just in the United States. I’m using data from both short commuter ride requests as well as longer travel ride requests. This sketch is a representation of the rides occurring each day, with the temporal resolution adjusted so that each car particle leaves its home and travels to its destination when clicked on, or at random intervals.
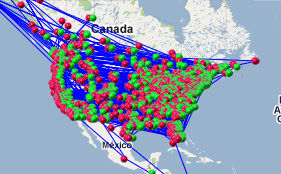
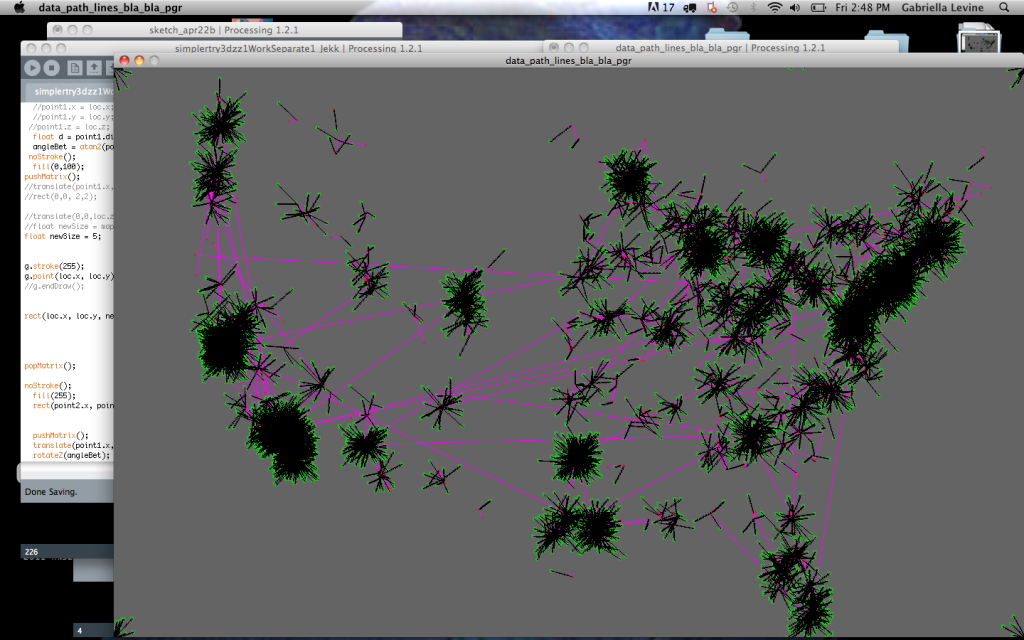
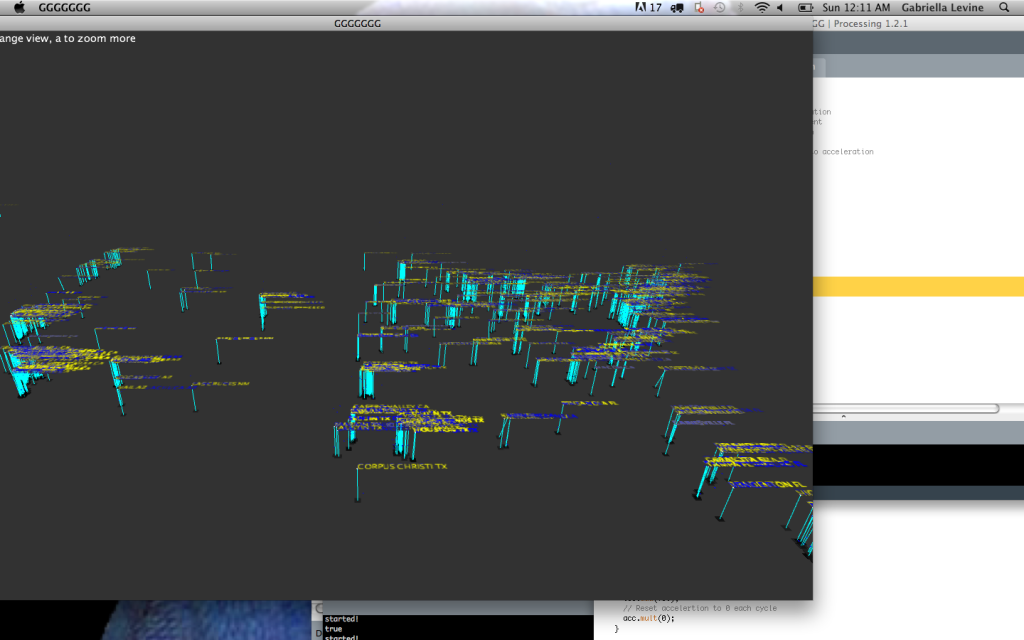
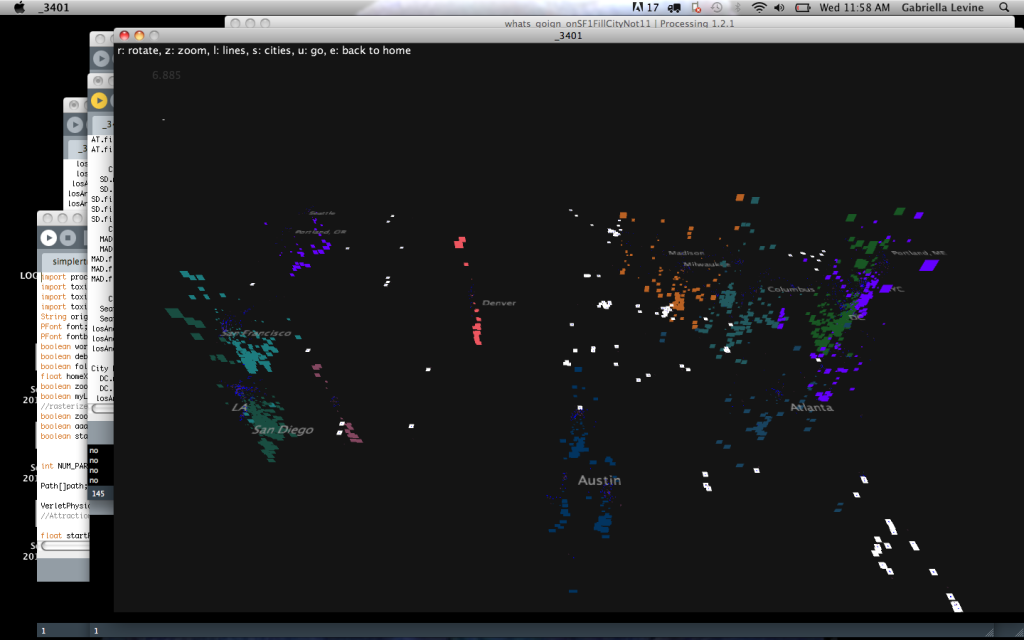
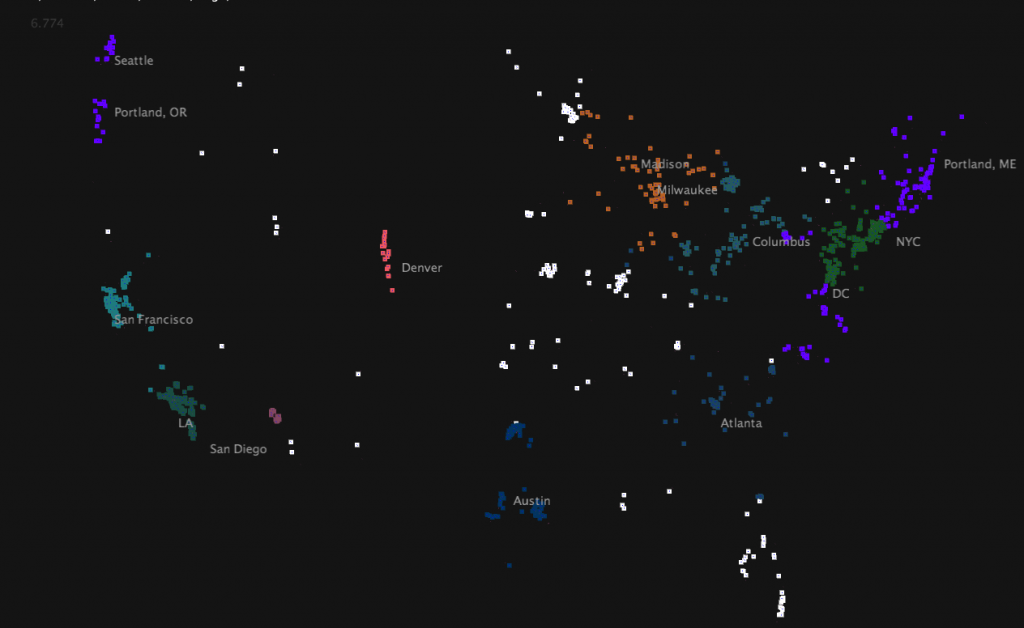
I am pulling the ride requests each day – after visualizing the cars laid out geographically, I noticed a lot of activity in cities, especially in the coastal regions. There are many more short term ride requests, and many overlapping rides. I wanted initially to create an interactive map that the user could zoom into easily.
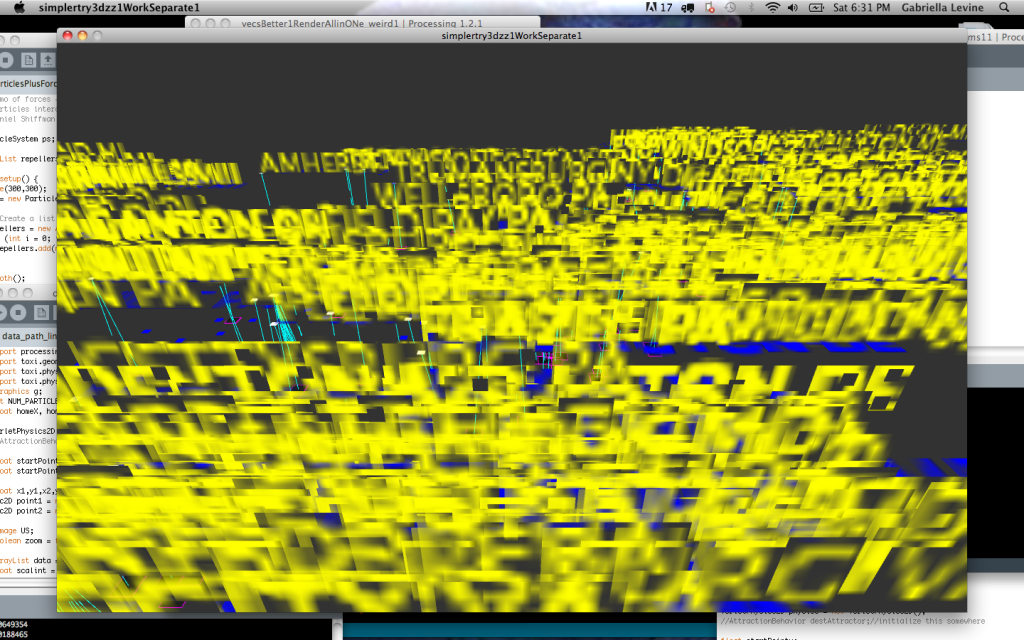
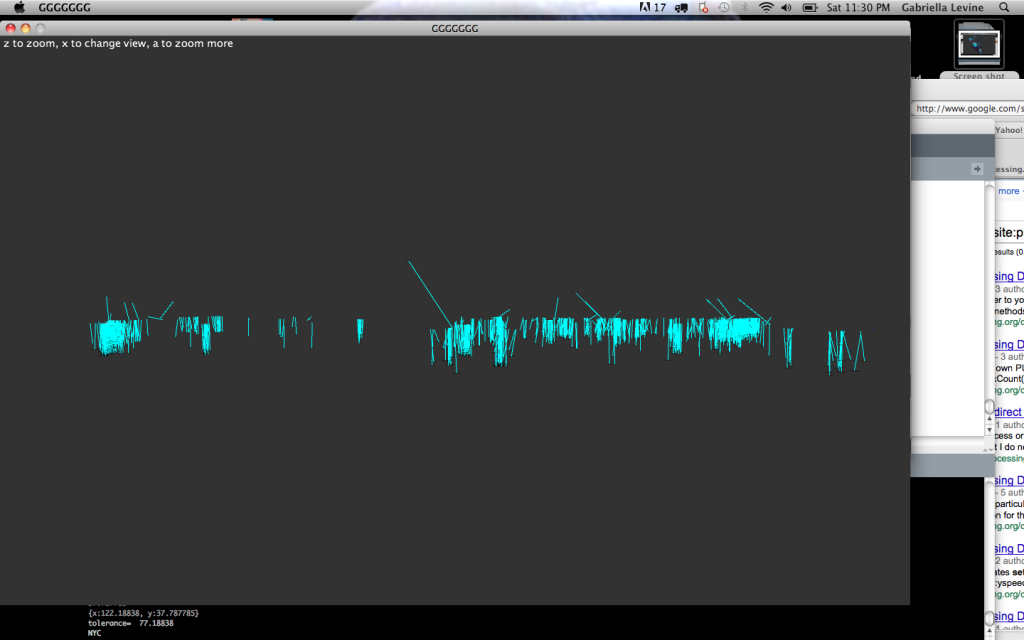
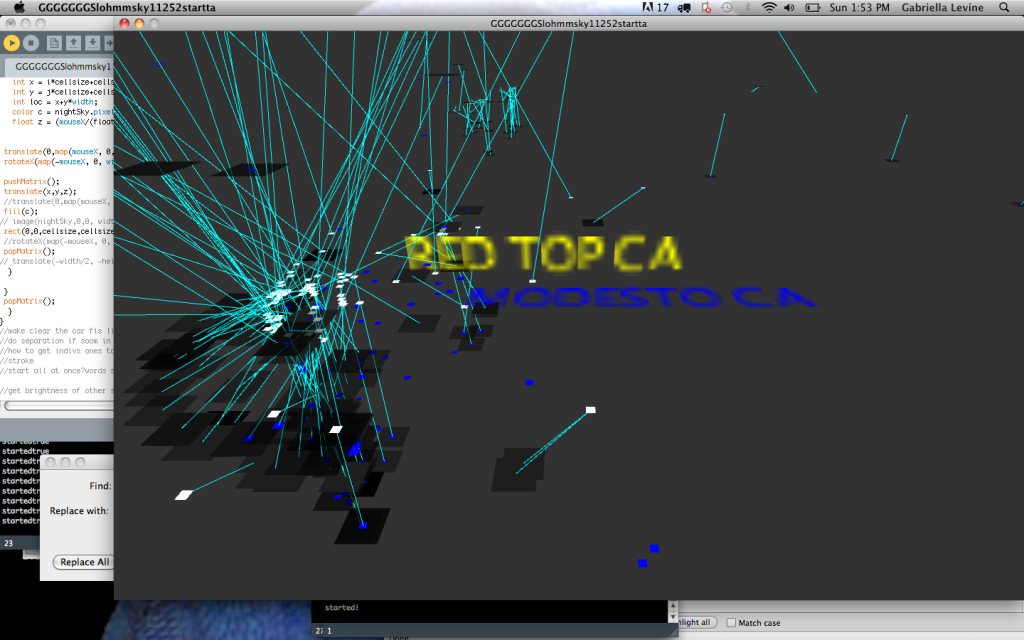
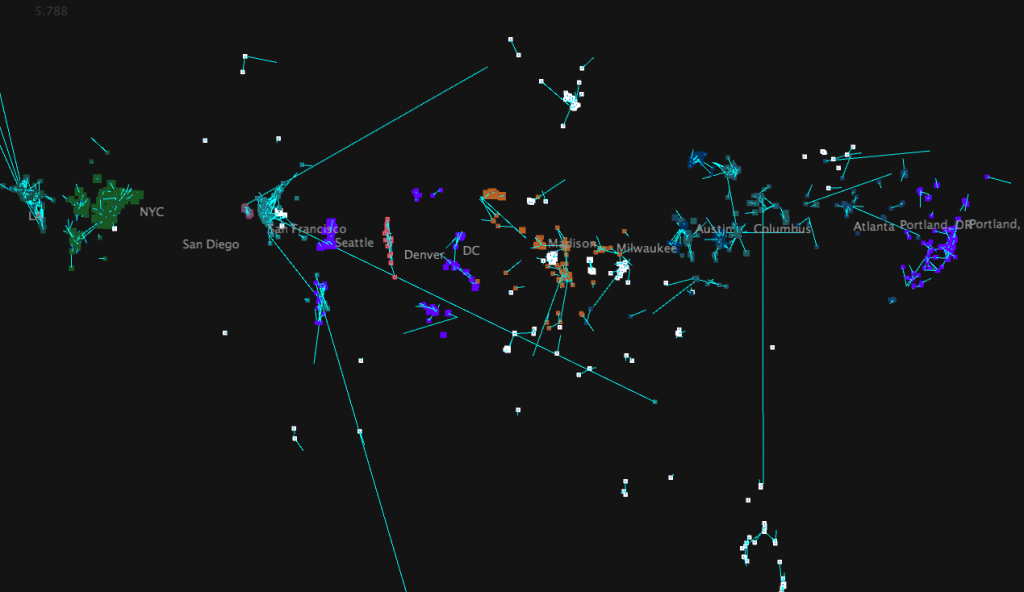
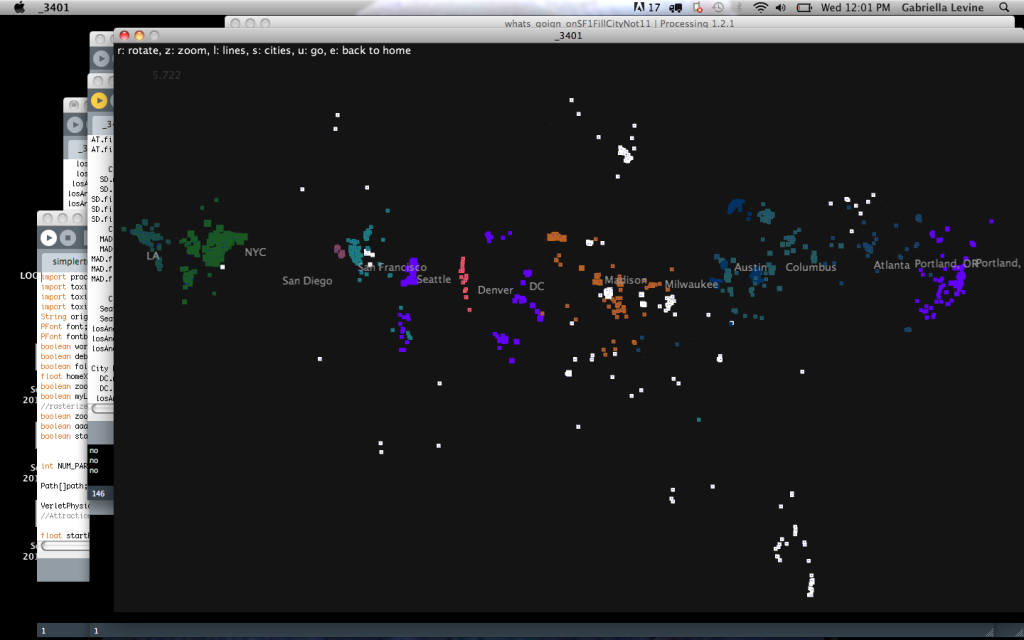
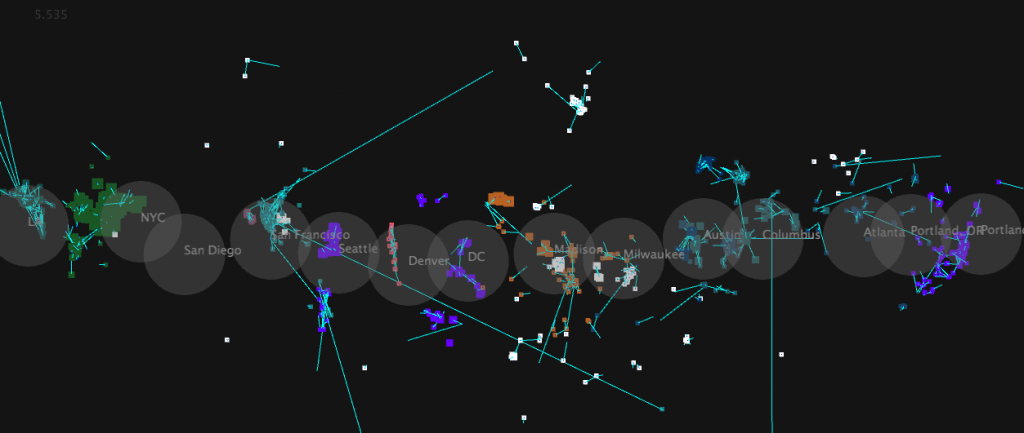
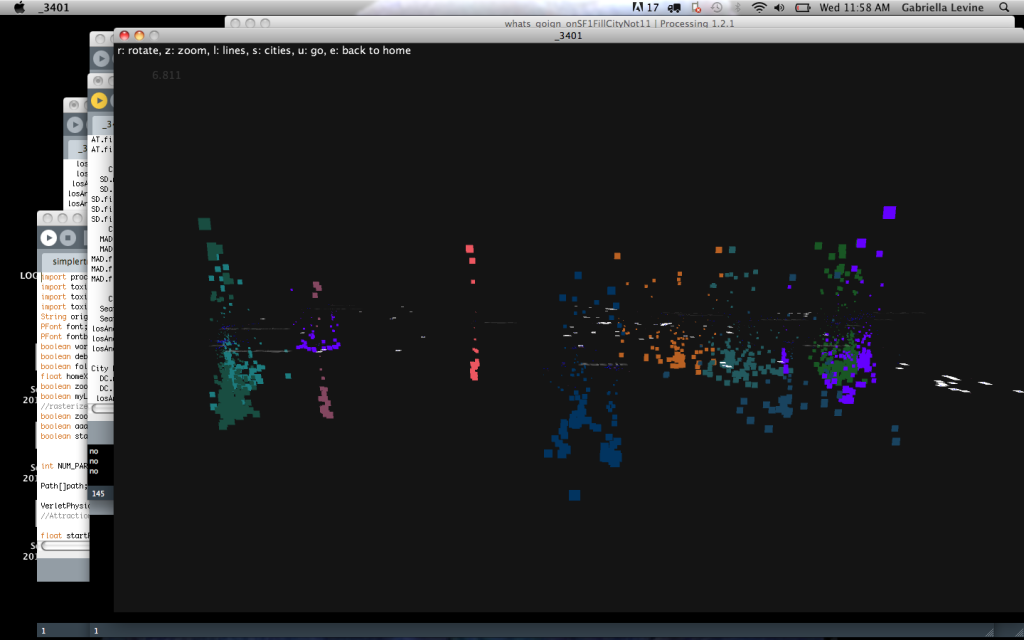
I decided to decontextualize the rides from their geographical setting in order to perhaps derive some new insight. So I assigned each car a city, and can arrange the cities in a line, in a circle, in order of population…
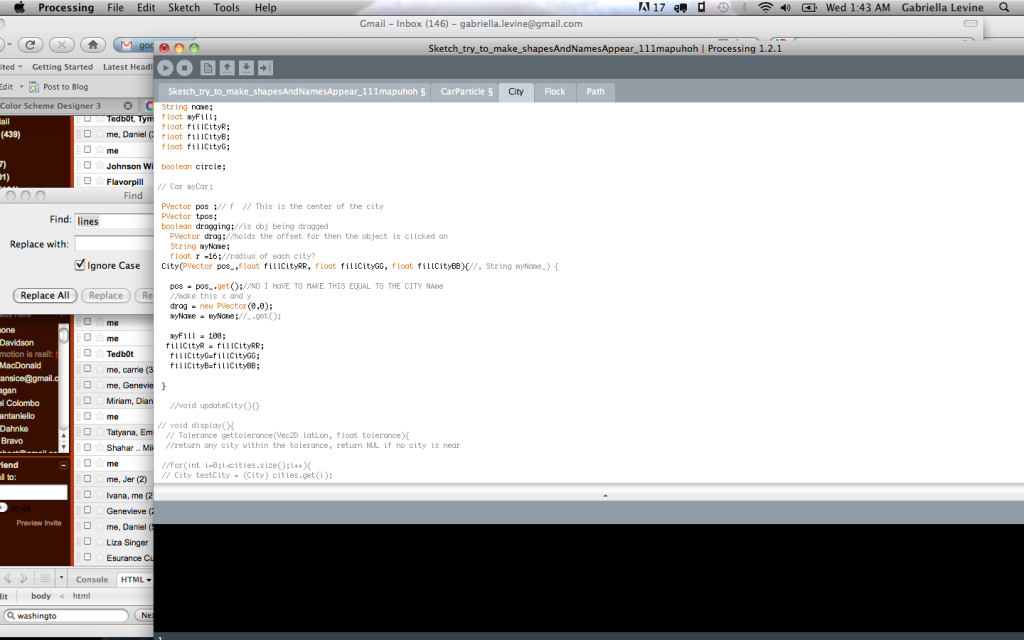
Technically:
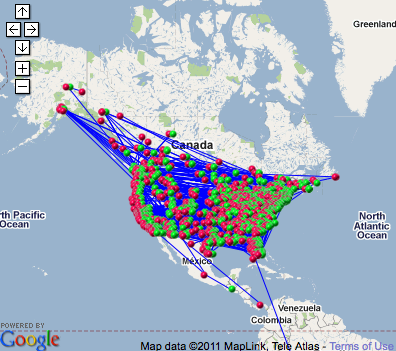
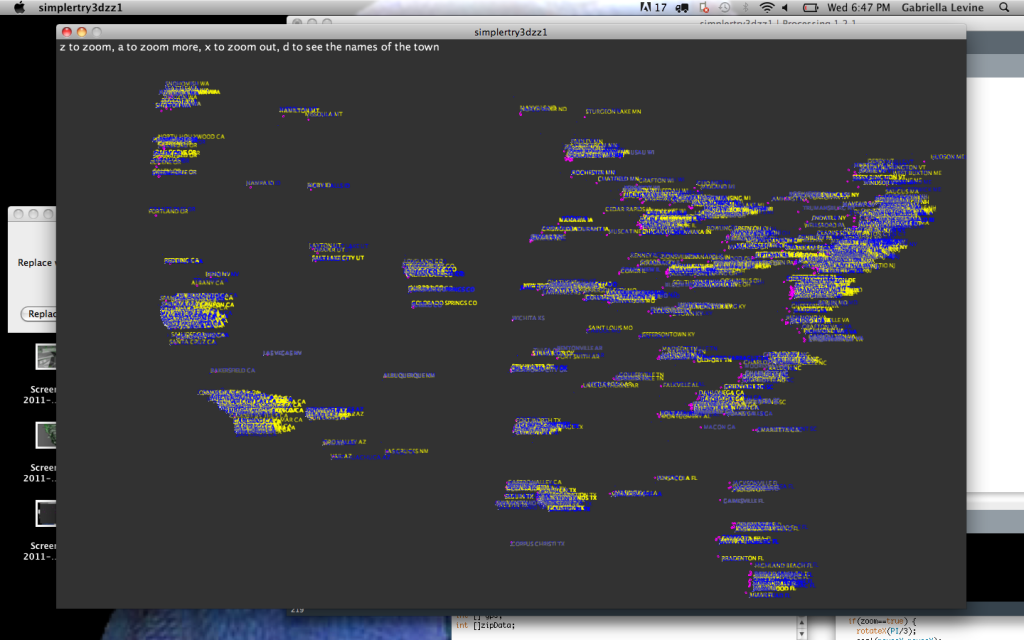
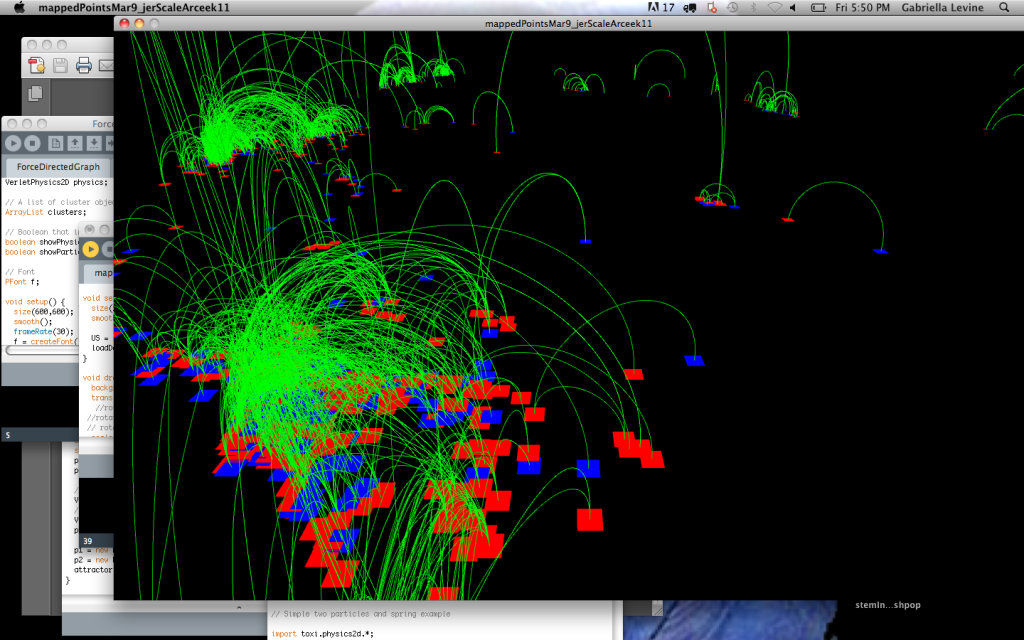
I plotted it on google maps, but wanted to make the car particles “alive” and mobile.
So without an API (google made it difficult for me to get the gps coordinates as strings) I’m using Python and a data set from census.gov of zipcodes converted to GPS lats and longitudes, to parse
“98337,98409| 33063,33442| 95602,95821| 95123,94043| 90815,92618| 90815,92618| 90815,92618| 07060,07054| 92603,90731| P0E1G0,L4N2M3| 94117,94941| 01778,01748| 90813,92626| 20720,20004| 08724,07016| 18360,11050| ”
into:
122.071562 47.895381 SNOHOMISH WA 122.200571 47.988431 EVERETT WA
78.390533 40.50524 ALTOONA PA 78.586068 40.460779 CRESSON PA
78.091224 38.233937 MONTFORD VA 77.093197 38.887103 ARLINGTON VA
71.35741 42.287476 NATICK MA 71.125611 42.377045 CAMBRIDGE MA
83.279236 42.643856 PONTIAC MI 83.282892 42.822272 OXFORD MI
Further:
-Adjust the speed and the graphics (cars, houses, garages)
-web app, temporal accuracy
-Take into account the size of the cities
-Show route information better
-Heat map? other effective visualization tools?
-Interesting information about carpooling and sharing (individual cities,  per capita, cartogram? different modes of city arrangement)
-design?
–>Biggest thing I got out of it:
What can I learn from data? How can I represent it differently to extract different patterns?
Some iterations I went through: